As AI seeps deeper into our judicial system, boosters insist it will bring both fairness and efficiency. But can we really trust Judge Grok?
Justice is often depicted as a blindfolded woman holding scales—but in real life, Justice is more like Santa Claus holding a shotgun. It sees everything: It sees whether you are rich or poor, whether you are powerful or powerless—and it sure as hell sees whether you are Black or white. Those observations tip the scales before any evidence is weighed. The idea of “blind justice” is a pure fiction, a cruel one invented by the rich, powerful, and white to justify the fickle, unfair, and prejudiced outcomes their legal system regularly produces.
In the United States, Black Americans suffer acutely from this failure. Black people experience an entirely different justice system than white people do, and almost everybody knows it. We are treated as guilty until “exonerated.” We are judged by predominantly white juries. We are tried under laws written by white people, for white people, and approved by white people, under a Constitution written by our white captors and enslavers. Even when we are murdered, we are put on trial so that the white people who killed us can walk free. I wouldn’t wish for my worst enemy to face justice-while-Black.
And the system isn’t much kinder to women, or poor people, or people who practice a non-Christian faith or live non-heteronormative lives. There is a “justice gap” in this country, and despite nearly a century’s worth of efforts to make the justice system apply to everyone equally, the results have been underwhelming.
Now, however, there is a new tool, widely promoted by rich white people, that purports to bridge the yawning gap between these different justice systems. That tool is artificial intelligence, and its boosters are sure that the robots are here to help. They tell us that the machines can produce justice more “efficiently,” bringing fair legal resolutions to people who do not have the resources to buy expensive lawyers, or the time to wait for the slow grinding of the wheels of justice. They tell us that the algorithms can bring an unbiased approach to sentencing and bail proceedings. They tell us that while AI should never fully “replace” human judges, the large language models can be a useful analytical tool for everything from statutory interpretation to determining what words are commonly thought to mean.
According to one such booster: “Technology, especially AI, can expand legal assistance and drive costs way down. That promises to democratize justice, helping those who have long taken their lumps and done without help.” That’s not a quote from Elon Musk or Sam Altman. That’s from Stephanos Bibas, a federal judge on the Third Circuit Court of Appeals, appointed by Donald Trump.
That’s also not how it’s gonna work. AI justice is largely being designed and promoted by private businesspeople interested in creating profits, not justice. It’s a closed-source, proprietary product, meaning that the beeps and boops that constitute its “reasoning” and “decision-making” cannot be exposed, analyzed, or argued against on appeal but can be tweaked in secret whenever a wealthy tech bro doesn’t like the AI outcomes. And AI justice will ultimately be just as biased as real judges, because all it can fundamentally do is spit back out to us all of the garbage racism we’ve poured into our justice system.
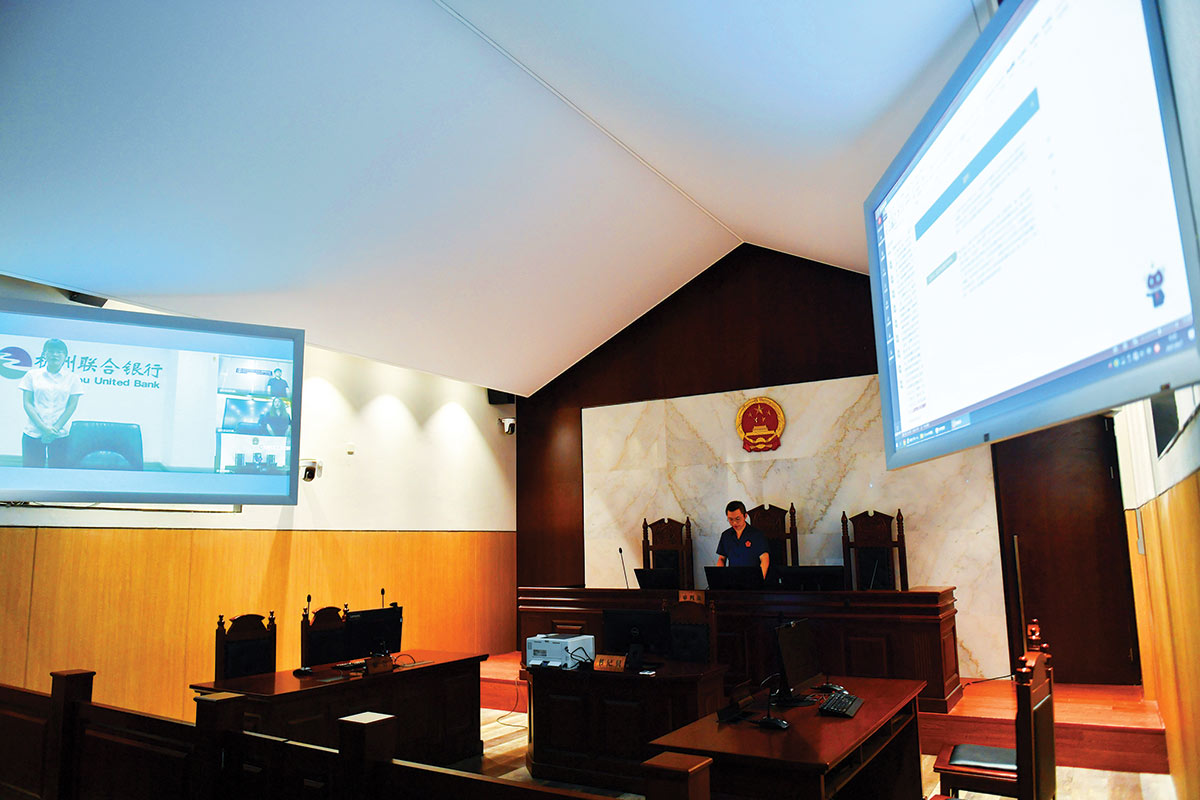
Robocourt: Seems to be an AI judge in a courtroom in China?(VCG / VCG via Getty Images)
Current Issue
AI justice can mean a lot of things—everything from a human judge using an algorithm to advise them on how to set bail to an AI judge that assesses evidence, weighs arguments, and issues binding rulings. Some people want to limit the use of the term AI to mean just “generative AI,” and the term AI justice to apply only to situations where a computer issues a final ruling. But to my mind, a judge who pulls out Claude instead of a dictionary to look up the meaning of a word in a statute is “using AI.”
Many countries are integrating AI into their judicial processes. Estonia is using AI judges to handle its version of small-claims court. Argentina is using AI to automate various processes and even using ChatGPT to draft legal rulings. Countries from the United Kingdom to Russia to Morocco are using AI in various ways to streamline legal processes. But no place has gone as far as China. Under Xi Jinping, China is on the leading edge of the robot-judge revolution. It has implemented a number of judicial reforms, including integrating information technology into all aspects of jurisprudence to create what it calls “smart courts.” Records are digitized, hearings happen online, automation is everywhere. Most of the reforms are designed to improve jurisprudential efficiency, in accordance with the slogan “Striving to make the people feel fairness and justice in every judicial case.”
China also employs AI judges. The government claims that millions of cases each year are adjudicated by AI, including financial disputes, product-liability cases, and even civil-rights cases. According to a Law360 report on the process, the AI is embodied by a “holographic judge [who] looks like a real person but is a synthesized, 3D image of different judges.” In Beijing, AI-judged cases can go from registration to resolution in an average of 40 days, with hearings lasting 37 minutes. According to reports, 98 percent of those AI rulings are accepted by the litigants and not appealed.
While legal and cultural differences between China and the United States abound (appealing a ruling you’ve lost is as ingrained in American culture as mass shootings and stealing land), human adjudication is slow and inefficient in both places. Cases that should be easy and don’t require anything but a simple application of well-established laws get backed up in a system that moves far too slowly. Not only is justice delayed—indeed, sometimes denied—but there’s also the deadweight economic loss that comes from just waiting for a decision, any decision at all, on whether a project can move forward or a contract can be executed.
But let’s not fool ourselves. Whatever robot judges offer us in terms of efficiency, the attempt to make people “feel fairness and justice,” as the slogan goes, is just that—an attempt to make people feel—and it’s a feeling that does not survive its first contact with reality. That’s because the robot judges are not deliberating; they’re just computing. They cannot reproduce the feeling of having your argument heard and listened to, which is inherent in the very idea of “having your day in court.” Even a “fair” process can feel unjust if it’s not transparent. You might be able to see through a hologram judge, but you can never see into it. You can never see how it thinks.
Efficiency, however, is only one of the alleged benefits of AI justice. Protecting vulnerable people is another, and there are plenty of people who argue that AI can do that. One example is the Oxford Institute of Technology and Justice, cofounded by Amal Clooney and Philippa Webb, both professors at Oxford. With the tagline “Harnessing the Power of AI for Justice,” the group seeks to bring legal representation to those who need it most. In a Time article describing their efforts, Clooney and Webb say they’re working with Microsoft’s AI for Good Lab to bring AI-lawyer chatbots to women in Malawi, where “almost one in ten girls is forced into marriage before turning 15.” They say they’re working with the Committee to Protect Journalists to provide at-risk reporters with free legal support. And they’re using AI to help pro bono lawyers file orders and determine best practices while defending abused women and children.
All of that is laudable. And yet, in the very same article, Clooney and Webb note the obvious dangers of AI justice. “AI is triaging cases, drafting pleadings, assessing witness credibility through facial-expression analysis and even generating avatars of murder victims that address defendants in court…. And courts across the world are grappling with deepfakes and manipulated evidence.” Sorry, folks, but “AI…assessing witness credibility through facial-expression analysis” is precisely when I turn into Morpheus from The Matrix and lead the resistance against the machines. I will never trust a white-bred AI system to assess my Black-ass credibility based on looking at my face.
In the US, judges are already using recommendations from AI algorithms to set bail and analyze the risks of recidivism. The system is called COMPAS (which stands for Correctional Offender Management Profiling for Alternative Sanctions), and its results are… not great, if you happen to be Black.
A 2016 study of COMPAS by Pro Publica found that “black defendants were often predicted to be at a higher risk of recidivism than they actually were,” while “white defendants were often predicted to be less risky than they were.” The report further revealed that “even when controlling for prior crimes, future recidivism, age, and gender, black defendants were 77 percent more likely to be assigned higher risk scores than white defendants.”
The company that makes COMPAS (it was called Northpointe back in 2016, but now it’s known as Equivant) said it doesn’t use race as a factor in its algorithm. Then, I shit you not, it defended its racist results by saying that the results were “fair” because the program is wrong about people 40 percent of the time regardless of race. That’s true—a COMPAS score is a little more accurate than a coin flip, if that makes you feel better. But because a Black defendant is more likely to be given a higher risk score than a white defendant, Black people who lose the coin flip could face higher bail than similarly situated white defendants, and that is racist.
But there are two larger takeaways from the COMPAS story beyond the system’s obvious racial biases. First, the astute reader will notice that I’m using a 2016 study from a media organization, not a 2025 study commissioned by the Department of Justice or the Supreme Court or a state Department of Corrections. That’s because, as far as I know, those studies do not exist, and if they do, they’re not publicly available. We don’t know who, if anybody, is even keeping track of COMPAS, its accuracy, or its biases. We also don’t have a great sense of how judges are using the thing, or the extent to which those judges are aware of its failure rate and biases. COMPAS is a tool, but for all we know, we’ve handed judges a racist sledgehammer they’re using to try to plunge a toilet.
The second problem is that I can’t tell you exactly what garbage COMPAS is recycling to produce its garbage results, because COMPAS is a closed-source algorithm made by a for-profit company that claims proprietary ownership of its process. The closed-source nature of its AI (and that of similar companies) is, or should be, anathema to people interested in justice, because justice is supposed to be the most open-source process in all of democratic self-government. The public is allowed to go to a trial and see literally all of the evidence a judge or jury considers before making a decision. Judges regularly issue opinions along with their rulings explaining exactly how they came to their decisions, including which specific cases and arguments they followed or rejected while deliberating the case. Their reasoning can be analyzed, questioned, and appealed to other judges, who might come to different conclusions based on the same publicly available evidence and logic.
That’s not the case with AI. That’s because AI’s “reasoning” is not, well, reasoning; instead, it’s probability based on vast quantities of data and other hocus-pocus, and the people who set the AI in motion don’t even really understand how it works. When you try to peel back the layers of why white South Africans are dominating your Twitter feed, or why YouTube thinks your kid should watch a video essay on how Princess Peach is “too woke,” or why a Black defendant got a higher risk score than a white one, all you get is corpo-speak platitudes that cannot be independently verified by anybody. The decision-making process is as crucial to justice as the decision itself, but the very first thing AI steals from us is the ability to review its process. AI gives us a sausage and then expects us to make the potentially deadly decision to eat it while only guessing at how it was made.
Being seen: The idea that justice is blind is a cruel fiction.(Ben Hasty / MediaNews Group / Reading Eagle via Getty Images)
Despite all this—despite the evidence of racial bias in the AI we already use and the real threat that more will be coded into the systems by private tech bros answerable to no one—it turns out that Black people might be more trusting of AI justice than white folks. A 2025 study published in the journal Behavioral Sciences asked participants if they would have more trust in a judge who relies only on their expertise to make bail and sentencing decisions, or a judge who consulted AI to make the same decision. While all groups preferred judges who relied only on human expertise, Black participants perceived judges who relied on AI to be “more fair” than their white and Hispanic counterparts.
I understand why some Black people feel like the AI would be more fair. Like them, I am well aware of what white judges are capable of. Fixing the racism, sexism, and prejudice endemic to the white judicial system has always been my goal. But so far, I don’t see how AI helps me do it. Just look at how AI justice is being regulated—or not being regulated—by the people chosen to represent our diverse, pluralistic society: Congress. Congress has passed no law regarding the development of AI’s use in the judicial system. Other countries, including China, are doing far more to regulate AI’s use in courts.
The problem is potentially even bigger than the usual congressional malfeasance. When it comes to AI justice, it’s not actually clear what powers Congress has under the constitutional separation of powers to regulate AI’s use by the judicial branch. Think of it this way: Congress can’t tell a judge’s law clerk or research assistant what to research or how to research it. Already, we have judges (they call themselves “originalists”) who functionally claim they can use a Ouija board to contact the spirit of James Madison to tell them whether a Trident II ballistic missile is a “traditional” means of self-defense protected by the Second Amendment. But Congress’s hands are tied: There’s not a damn thing it can do constitutionally to stop Clarence Thomas from using historical slop to make his rulings, so why would there be anything Congress could do to stop him from using AI slop instead?
As usual, the judicial branch is not filling the breach and regulating itself. It is the Wild West out there, with some judges using Claude (or whatever the hot AI is by the time you read this) to give them interpretations of statutory language, while others completely disregard AI as an analytical or research tool. If the judicial branch ever does deign to impose rules on itself, it’ll be people like Chief Justice John Roberts issuing “guidance” on how judges should use this technology that they almost certainly don’t understand. Roberts’s Supreme Court will either approve or overturn cases in which the evidence, research, or analysis is heavily influenced by AI, and that will be the signal for how AI should be used. I don’t know yet how he will rule on such issues, but this is where I point out that nobody elected John Roberts, and his unaccountable job functions should not include “determining how much AI is good for the rest of us.”
The people making the real decisions about the role of AI in our justice system won’t be us or even our elected representatives. It won’t really be the justices and judges either. It will be the people who design the AI models and own the for-profit companies that produce them—and these people are, to put it mildly, fucking weirdos. I can honestly say that I never sympathized with the guys who sentenced Socrates to drink hemlock until I started reading about TESCREALism, an acronym created by the scholars Timnit Gebru and Émile P. Torres to capture the truly wack mixture of interconnected beliefs held by our tech-bro overlords: transhumanism, extropianism, singularitarianism, cosmism, rationalism, effective altruism, and longtermism.
I have extensive familiarity with bad sci-fi literature and video games, but even I had to look up most of these terms. They basically add up to this: These people want to replace us all with machines and live forever in a future digital dystopia that they’re convinced will be heaven. I’m used to people playing God, but these guys think they can create God.
Still, you don’t need to understand the AI bros’ philosophy to spy that their conception of “justice” is a little different from those of the great moral philosophers, from the aforementioned Socrates to John Rawls and Derrick Bell and everyone in between. If you read Torres, you’ll discover that many of them want to create (not making this up) an intergalactic and immortal society, and if that requires some massive injustice along the way, so be it. It’s utilitarian, in a way, if you took utilitarianism to its stupidest and most genocidal conclusion.
And yet, even as I was reading about the truly dystopian beliefs of our tech-bro edgelords, I could hear the grown Black voice inside my head saying, “Sure, this all sounds bad, but have you met Justice Samuel Alito?” The promises and dangers of AI justice have to be plotted against the lived experience of the current justice system, and the juxtaposition isn’t pretty. I find myself playing the worst possible game of “Would You Rather”: Would you rather have Justice Alito or Justice MechaHitler? Would you rather have Donald Trump picking the judges, or Peter Thiel? Would you rather have Leonard Leo programming the judges, or Sam Altman?
(left to right. top to bottom: Erin Schaff-Pool / Getty Images; Wolfenstein 3d; Sait Serkan Gurbuz / AP; Eugene Gologursky / Getty Images for The New York Times; Shawn Thew / EPA/Bloomberg via Getty Images; Nordin Catic / Getty Images)
Friends, I can’t tell you what the right answers are (which is to say, I can’t actually bring myself to write “I choose Justice Alito” without adding the coda “to be punted into the sun”). But I can tell you that a choice between evils is the right way to frame the question. AI boosters will tell you that AI justice offers the promise of nonpartisan, unbiased, purely logical decision-making—when it’s anything but. AI cannot be programmed to be fair, because we humans don’t even agree on what “fair” is. AI cannot be programmed to be just, because our definition of justice is ever-changing. AI will not make sense of all of our illogical inconsistencies; it will just digest them and spit them back out to us in some weird, uncanny form. Then, one horrible day, it will claim a Second Amendment right to defend itself, even if that leads to the deaths of schoolchildren, just like we do.
What I can also tell you is that AI justice will not be great for Black people. I understand all of the problems with the current judicial system, especially with how it treats people who look like me, but the very last thing AI can promise is fairness. Efficiency, access, speed, cost control—all of that might be on the table. But fairness? Nothing about the way AI is being developed and implemented suggests that it will be fairer, more transparent, or more just than the human-led system we currently have. And I struggle to think of a single technology yet invented that hasn’t been manipulated by white folks to cause more oppression.
From the cotton gin to Twitter, when the ruling class of whites get their hands on a new toy, they find a way to use it to promote racial and social stratification instead of using it to foster equality. There’s no earthly reason to believe AI will be any different.
We are not standing outside the gates of utopia; we’re standing outside a portal to the demon realm, and the final boss is telling us, “Choose the form of the Destructor.” If we try to not choose anything, we’re five minutes away from an AI marshmallow man wrecking our society.
From illegal war on Iran to an inhumane fuel blockade of Cuba, from AI weapons to crypto corruption, this is a time of staggering chaos, cruelty, and violence.
Unlike other publications that parrot the views of authoritarians, billionaires, and corporations, The Nation publishes stories that hold the powerful to account and center the communities too often denied a voice in the national media—stories like the one you’ve just read.
Each day, our journalism cuts through lies and distortions, contextualizes the developments reshaping politics around the globe, and advances progressive ideas that oxygenate our movements and instigate change in the halls of power.
This independent journalism is only possible with the support of our readers. If you want to see more urgent coverage like this, please donate to The Nation today.
Migraine is a prevalent neurological disorder characterized by recurrent moderate-to-severe headaches, accompanied by photophobia, phonophobia, nausea, and vomiting. It presents complex pathophysiology involving both central and peripheral mechanisms, including peripheral and central sensitization, lack of habituation, thalamo-cortical dysrhythmia, and hyperexcitability of the motor cortex. These mechanisms are crucial contributors to the substantial burden of migraine.1,2 According to the Global Burden of Disease (GBD) studies, migraine impacts over one billion people and is a primary cause of disability worldwide.3,4 Since 1990, the burden of migraine (encompassing absolute case counts, crude rates, and DALYs) has risen significantly. This increase is particularly pronounced in low- and middle-income countries (LMICs), where healthcare resources are often limited.5–7 The condition severely impairs quality of life and functional capacity.8 Beyond its health impact, migraine also imposes a substantial economic toll. In India, for example, productivity losses are estimated at 17.3 workdays per patient annually, amounting to approximately $22.21 billion.9 Migraine not only poses a strain on healthcare systems, such as increased resource requirements, but also diminishes individual well-being. Hence, it is imperative to address migraine in LMICs.10
Women of reproductive age (15–49 years) are disproportionately affected and represent a high-risk subgroup. Hormonal fluctuations during these years are known to exacerbate and chronify migraine.11,12 Furthermore, in many LMICs, socioeconomic factors (eg., unpaid caregiving duties) and environmental exposures (eg., PM2.5 air pollution) may further compound the risk and burden in this population.9,13 Consequently, focused attention on the disease burden among reproductive-age women in LMICs is essential.
Although GBD studies have provided valuable insights into global migraine prevalence, current global analyses remain limited for this vulnerable population, as most studies aggregate data across broad regions or general populations without targeted long-term trend assessments of migraine burden among reproductive-age women in LMICs.5,14 These gaps necessitate updated, targeted analyses. Therefore, the current research aims to comprehensively examine trends in migraine burden among reproductive-age women (15–49 years) in LMICs from 1990 to 2023. To achieve this, we analyzed recent GBD 2023 data using advanced analytical methods, including decomposition analysis and projections. The findings are expected to inform targeted prevention and control strategies for this vulnerable population.
Materials and Methods
Data Sources
The officially published GBD 2023 database was used for all analyses in the current study. GBD offers systematic estimates for 463 diseases and injuries across 204 countries and territories from 1990 to 2023. In the GBD framework, these estimates are generated by synthesizing diverse sources, including censuses, household surveys, disease registries, and scientific literature. Standardized modeling tools (eg., DisMod-MR 2.1) are then applied to ensure consistency and comparability of the estimates (Global Burden of Disease Study 2023, IHME, 2024).10,15
Migraine burden estimates for reproductive-age women (15–49 years) in LMICs were extracted from the Global Health Data Exchange results tool. These estimates comprised key metrics: prevalence, incidence, and DALYs, all of which were reported alongside 95% uncertainty intervals (95% UI). Estimates were first extracted for 5-year age strata (15–19, 20–24, 25–29, 30–34, 35–39, 40–44, 45–49 years), then directly aggregated to derive the overall reproductive-age group (15–49 years) by summing case counts and calculating population-weighted crude rates. DALYs rates were standardized per 100,000 population for cross-population and temporal comparisons.
Disease and Key Indicator Definitions
Disease Definition
Migraine was defined as per the International Classification of Headache Disorders (3rd edition) as a primary headache disorder. It is marked by recurrent, moderate-to-severe headaches. These headaches are often unilateral and pulsating, and typically accompanied by photophobia, phonophobia, or nausea.16 International Classification of Diseases (ICD) codes (ICD-9: 346–346.93 and ICD-10: G43-G43.919) were utilized to identify cases in the GBD study.15,16
GNI
Countries were stratified by economic level using the World Bank’s 2023 fiscal year classification, which is based on GNI per capita.17 GNI per capita reflects the total domestic and foreign value added claimed by a country’s residents. It is a key indicator for comparing economic development. According to this classification, the 2023 income categories are: low-income (GNI-L; ≤ $1,145), lower-middle-income (GNI-LM; $1,146–$4,515), and upper-middle-income countries (GNI-UM; $4,516–$14,005). Our analysis focused on 129 LMICs as per this classification. The following aggregated groups were created: “LMICs”, “GNI-L”, “ GNI-LM”, and “ GNI-UM”.
Socio-Demographic Index (SDI)
The SDI is a composite indicator developed by the Institute for Health Metrics and Evaluation (IHME) to quantify societal development. It integrates educational attainment among individuals aged 15 and older, average lag-distributed income per capita, and the total fertility rate under 25.18
Statistical Analysis
Estimated Annual Percentage Change (EAPC) and Percentage Change
To quantify the temporal trends in migraine burden among reproductive-age women (15–49 years) in LMICs from 1990 to 2023, two key metrics were employed: the EAPC and the percentage change.16
The 95% confidence interval (CI) for the EAPC was calculated using a linear regression model.19 The trend was interpreted as follows. Where both the EAPC value and the lower bound of its 95% CI exceeded 0, a significant increasing trend was identified. Where both the EAPC and the upper CI bound were below 0, the trend was considered significantly decreasing. In cases where the 95% CI included 0, no statistically significant trend was concluded.20
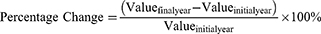
Percentage change was used to assess the overall relative change in the absolute number of cases (eg., prevalent cases, incident cases) or the crude rate between the start year (1990) and the end year (2023). It was calculated as:
This measure provides a straightforward interpretation of the total magnitude of change over the entire study period and complements the annualized trend captured by the EAPC.15
Decomposition Analysis
To elucidate the respective contributions of demographic transitions and epidemiological transformations to the trends in migraine burden among reproductive-age women (15–49 years) in LMICs from 1990 to 2023, a decomposition analysis was performed using the Das Gupta method.14,16 This approach quantitatively disaggregates total changes in disease burden metrics—such as incidence, prevalence, and DALYs—into components attributable to three key factors: population growth, population aging, and epidemiological changes. The contributions of these three components were calculated as absolute differences and relative percentages of the total observed change. A positive contribution indicated that the factor increased the disease burden over the period, whereas a negative contribution signified that the factor reduced the burden.14 This analysis provided critical insights into the underlying drivers of migraine burden trends and informed targeted public health interventions.
Autoregressive Integrated Moving Average (ARIMA) Model
The ARIMA model was applied to forecast the future trends in migraine burden, specifically DALYs, among reproductive-age women (15–49 years) in LMICs up to the year 2050.10,21 The ARIMA framework is a potent statistical technique for time series analysis and prediction. It effectively captures underlying patterns, trends, and potential seasonal fluctuations. The ARIMA (p, d, q) model integrates three key components: the autoregressive (AR) component (p), the differencing (I) component (d), and the moving average (MA) component (q). Historical data on annual DALYs from 1990 to 2023 were used as the training dataset for model fitting. The optimal combination of (p, d, q) parameters was determined using a systematic approach. The approach minimized information criteria, specifically the Bayesian information criterion (BIC) and Akaike information criterion (AIC). Therefore, it ensured a parsimonious and well-fitting model.15 The fitted ARIMA model was then used to generate projections for DALYs (with 95% uncertainty intervals [UIs]) from 2024 to 2050. This provided a probabilistic assessment of future burden trends.
This study was conducted in accordance with the Declaration of Helsinki. Since the research involved the secondary analysis of publicly available, de-identified data from GBD, it was exempted from formal ethical review by the Institutional Review Board of PKUCare Rehabilitation Hospital. This exemption is based on Items 1 and 2 of Article 32 of the “Measures for Ethical Review of Life Science and Medical Research Involving Human Subjects” (issued on February 18, 2023, by the National Health Commission of China), which stipulate that ethical review may be exempted for research utilizing publicly available data or anonymized data. Informed consent was not required as the data were aggregated and did not contain identifiable personal information.15,22 The results were reported following the Strengthening the Reporting of Observational Studies in Epidemiology guidelines.23
Statistical analyses were conducted in R (v4.3.2). Significance was defined as a two-sided p-value < 0.05.
Results
Trend Analysis
LMICs
From 1990 to 2023, the absolute burden (absolute numbers of prevalent cases, incident cases, and DALYs) of migraine increased substantially among women aged 15–49 years in LMICs. The most notable elevation was observed in DALYs (68%, 95% UI: 62–74%), followed by prevalent cases (67%, 95% UI: 61–73%) and incident cases (61%, 95% UI: 55–67%) (Table S1). As this study focused on a narrow reproductive-age population and did not conduct age standardization, the crude rates were examined and exhibited an upward trend, with the most pronounced increase seen in DALYs (EAPC: 0.17, 95% UI: 0.16–0.18).
In addition, Joinpoint regression analysis was implemented to delineate the temporal trajectory and identify potential inflection points. The results confirmed a consistent, significant upward trend from 1990 to 2023. The average annual percentage changes (AAPCs) were 0.33% for DALYs, 0.31% for prevalence, and 0.10% for incidence (P < 0.05 for all). However, the temporal patterns diverged among the three metrics (Figure 1). The prevalence stabilized around the year 2000 and then increased. The incidence exhibited a more volatile trajectory, with multiple phases of expansion and contraction. It had three distinct expansion phases: 1990–1995 (APC = 0.06), 2000–2005 (APC = 0.23, P < 0.05), and 2013–2020 (APC = 0.17). Such expansion was interrupted by two contraction periods: 1995–2000 (APC = −0.17, P < 0.05) and 2005–2013 (APC = −0.07). Conversely, DALYs increased steadily after 1996.
Figure 1 Global cartographic distribution of migraine burden indicators among reproductive-age women (15–49 years) in low- and middle-income countries, 2023. (a) Age-standardized prevalence rate (per 100,000 population). (b) Age-standardized incidence rate (per 100,000 person-years). (c) Age-standardized disability-adjusted life years rate (per 100,000 population). Data derived from Global Burden of Disease Study 2023. Color gradients represent magnitude quintiles. Remarks:* Indicates that p is less than 0.05.
GNI
The EAPCs further highlighted divergent trends across income groups. Significant declines were observed in GNI-L and GNI-LM, while notable increases were seen in GNI-UM (EAPCs for GNI-UM: 0.31 for prevalence, 0.09 for incidence, and 0.34 for DALYs; Table S1). Joinpoint analysis elucidated this divergence by revealing distinct temporal trajectories. Sustained declines were observed in GNI-L across all indicators throughout the study period. The steepest reductions in prevalence occurred during 2012–2017, and the steepest reductions in incidence occurred during 2012–2018. A more modest overall reduction in the disease burden was noted in GNI-LM; however, this trend was interrupted by a transient increase in DALYs between 2010 and 2015. Conversely, the most significant increase was seen in GNI-UM. The elevation was marked by sharp rises in prevalence and DALYs between 2015 and 2019.
National Level
At the national level, the most substantial percentage increases in migraine burden were observed in Jordan, Equatorial Guinea, and Djibouti. This heterogeneity aligned with the SDI-based findings. For instance, the disease burdens in Peru (with the most marked deterioration in age-standardized DALYs, EAPC = 0.41) and China (EAPC = 0.39) exceeded SDI-based expectations. A similar pattern was observed for prevalence and/or DALYs in Brazil, Thailand, Iran, and Egypt. A contrasting divergence was observed in incidence, which was lower than expected in Peru, Djibouti, and Rwanda but higher in the Philippines, Iran, and Indonesia (Table S2–S7, Figures 2 and 3).
Figure 2 Differential age-stratified trajectories of migraine burden among reproductive-age women, 1990–2023. (a) Prevalence rate trajectories across age groups. (b) Incidence rate trajectories by age stratum. (c) Disability-adjusted life years rate progression through age cohorts. Shaded areas represent 95% uncertainty intervals. Data derived from Global Burden of Disease Study 2023.
Figure 3 Economic gradient of migraine burden among reproductive-age women: Cross-sectional correlation analysis between gross national income (GNI) and disease indicators, 2023. (a) Scatter plot of age-standardized prevalence rate vs GNI per capita (R = 0.243, P = 0.007). (b) Incidence rate vs GNI per capita (R = 0.095, P = 0.296). (c) Disability-adjusted life years rate vs GNI per capita (R = 0.230, P = 0.010). The solid line represents the LOESS smoothing curve with a 95% confidence band. Points colored by GNI stratum: low-income (red), lower-middle (blue), upper-middle (green).
Analysis of the Correlation Between the SDI and GNI
A detailed correlation analysis at the national level further clarified the intricate relationship between economic development and migraine burden. No statistically significant linear correlations were observed between GNI per capita and any indicator for migraine burden (P > 0.05) (Figure 4). However, substantial heterogeneity was observed when examining the SDI. Analysis of the observed-to-expected ratios across SDI quintiles revealed marked divergence in burden levels by country (Figure 5). The prevalence was notably lower than expected in countries such as Ethiopia and Malawi and notably higher than expected in Brazil and Thailand. A similar pattern was noted for DALYs: lower-than-expected prevalence values were seen in Ethiopia and Mozambique, while higher-than-expected prevalence values were identified in Iran and Egypt. The incidence was lower than expected in South Sudan and Rwanda, and higher than expected in Iran and Indonesia. Overall, these data revealed substantial heterogeneity in migraine burden across countries with similar levels of development. The results highlighted the influence of unique contextual factors beyond aggregate socioeconomic indicators.
Figure 4 Spatiotemporal evolution of migraine burden indicators among reproductive-age women (15–49 years) in low- and middle-income countries: Estimated annual percentage changes (EAPC), 1990–2023. (a) EAPC of the age-standardized prevalence rate. (b) EAPC of the age-standardized incidence rate. (c) EAPC of age-standardized disability-adjusted life years rate. Warmer hues (red/Orange) denote increasing trends; cooler hues (blue/green) signify declining trends. Data derived from Global Burden of Disease Study 2023.
Figure 5 Temporal heterogeneities in migraine burden trends among reproductive-age women (15–49 years) across income subgroups: Joinpoint regression analysis, 1990–2023. (a) Segmented trend of age-standardized prevalence rate with annual percentage change (APC). (b) Segmented incidence rate trend with APC. (c) Segmented disability-adjusted life years rate trend with APC. Solid circles denote statistically significant turning points (p<0.05). Data derived from Global Burden of Disease Study 2023.
Abbreviation: AAPC, Average annual percent change.
Age-Specific Trends
Across LMICs, migraine incidence peaked among women aged 25–29 and then gradually declined with age. In contrast, both prevalence and DALYs increased with age, peaking at 40–44 years of age and then decreasing slightly. The highest rates were consistent across all age groups in GNI-L (Figure 6).
Figure 6 Socio-demographic gradient of migraine burden: Correlation of composite development indicators with disease metrics among reproductive-age women, 2023. (a) Association between age-standardized prevalence rate and Socio-demographic Index (SDI) (ρ = −0.41, p < 0.001). (b) SDI-incidence rate association (ρ = −0.23, P = 0.02). (c) SDI-disability-adjusted life years rate association (ρ = −0.38, P < 0.001). LOESS curves with 95% CI bands. Points colored by SDI quintile: low (red), low-middle (Orange), middle (yellow), high-middle (light green), high (dark green).
Decomposition Analysis
Decomposition analysis revealed distinct drivers of the increasing migraine burden among women aged 15–49 across income subgroups in LMICs (Figure 7 and Table S8). From 1990 to 2023, prevalence, incidence, and DALYs increased consistently across all GNI subgroups. The most pronounced elevation was in GNI-LM, followed by GNI-L and GNI-UM. Population growth was the dominant driver. Notably, population expansion contributed 107.18% to the increase in prevalent cases in GNI-L (exceeding the total observed increase, with other components partially offsetting burden growth), 100.59% in GNI-LM, and 53.62% in GNI-UM. This illustrated its varying influence across different levels of socioeconomic development.
Figure 7 Attributable drivers of migraine burden evolution among reproductive-age women: Demographic decomposition analysis by income stratum, 1990–2023. (a) Factor decomposition of prevalence rate variations. (b) Incidence rate changes attributed to demographic components. (c) Disability-adjusted life years rate transitions partitioned by drivers. Bars represent absolute contributions: aging (red), population growth (gray), and epidemiological transition (blue). Negative values indicate burden-reducing effects.
In contrast, epidemiological changes offset 1.58% to 8.06% of the effect of population expansion in GNI-L and GNI-LM. However, these changes contributed 37.24% to 45.42% to the increase in GNI-UM.
Population aging had a modest, though varied, influence on migraine burden. The direction of its effect (exacerbating or protective) depended on the specific measure and country income level.
ARIMA Model
An ARIMA model was fitted to the 1990–2023 DALYs series for women aged 15–49 in GNI-L and GNI-LM. The model was then used to project the burden to 2050. The optimal model orders, together with the corresponding AIC, BIC, and Ljung–Box test p-values, are reported in Table S9. The Ljung–Box statistic indicated white-noise residuals for the chosen model parameters (p > 0.05). This confirmed an adequate model fit and stability.
Unlike the global downward trajectory reported for several other neurological disorders, the projected DALYs for migraine in this population increased modestly but steadily over the next 26 years. Specifically, the model estimates that age-standardized DALYs will rise from 954.42 (95% CI: 943.81–965.03) per 100,000 individuals in 2024 to 994.98 (95% CI: 980.66–1,009.30) per 100,000 individuals by 2050. This represents an average annual increment of 1.56 per 100,000 individuals (Figure 8). The projections are provided in Table S10.
Figure 8 Temporal projections of age-standardized DALYs burden attributable to migraine in women aged 15–49 years in low/lower-middle-income countries: An ARIMA forecast (1990–2050). Solid red line: Observed DALYs rates from 1990 to 2023. Dashed blue line: ARIMA model projections (2024–2050). Grey shaded area: 95% prediction intervals. The optimal ARIMA (0,1,1) model was selected based on minimized AIC (90.02) and BIC (93.01), with the Ljung–Box test confirming residual whiteness (p = 0.33). Projections indicate a gradual increase from 954.42 (95% CI: 943.81–965.03) per 100,000 in 2024 to 994.98 (95% CI: 980.66–1,009.30) by 2050.
Discussion
The present research used the GBD 2023 data to comprehensively analyze the trends of migraine burden from 1990 to 2023 among reproductive-age women (15–49 years) in GNI-L and GNI-LM. Our findings revealed a significant upward trajectory in migraine burden. The overall increase was approximately 67% in prevalent cases, 61% in incident cases, and 68% in DALYs over the 33-year period. Differences in burden drivers were observed across economic subgroups. Population growth was the dominant factor in GNI-L and GNI-LM. In GNI-UM, epidemiological changes acted in concert with demographic factors to significantly exacerbate the burden. Given this key distinction, stratified public health responses are required. Additionally, the ARIMA model projects a continued rise in DALYs, which are expected to reach 994.98 per 100,000 by 2050. This further underscores that targeted interventions are necessary.15,16
The current analysis first quantified a substantial increase in the absolute burden (absolute case numbers) of migraine among women aged 15–49 in LMICs from 1990 to 2023. Significant upward trends were also noted in crude rates. This confirmed that the burden of migraine intensified beyond what demographic changes alone would predict. This rising burden is driven by population growth and aging, suggesting that healthcare systems in these countries may face mounting pressure in the coming years.15 The Joinpoint analysis further refined the understanding of these temporal patterns. The results revealed that the steady rise in prevalence and DALYs masked a more volatile trajectory of incidence, marked by distinct expansion and contraction phases. This volatility suggests that incident cases of migraine may be more sensitive to transient societal, environmental, or diagnostic factors than the more cumulative indicators of prevalent cases and DALYs.
Stratified analysis was performed by income level. The results revealed a sustained decline in the disease burden in GNI-L and a pronounced surge, particularly after 2015, in GNI-UM. This finding is different from the traditional review of a uniformly increasing burden across LMICs. The steepest reductions in GNI-L and the sharp increases in GNI-UM demonstrate that the stage of economic development is a pivotal determinant of migraine burden trajectory. This divergence is strongly supported by the opposing EAPCs across these income subgroups.
The correlation analysis further elucidated the complex relationship between economics and disease burden. The absence of significant linear correlations between GNI per capita and burden metrics suggests that wealth alone does not directly predict migraine burden. The variations in migraine burden were observed across countries at different levels of development. This pattern may be partly explained by increasing exposure to environmental and occupational risk factors during economic transition. Simultaneously, the necessary healthcare infrastructure and public awareness for effective migraine management often lag behind during this period.24,25
Additionally, the substantial heterogeneity observed within SDI quintiles and at the national level underscores the limitations of aggregate economic and developmental indices. Specifically, Brazil, Thailand, and Iran consistently exhibited a higher-than-expected burden. Ethiopia, Malawi, and Mozambique showed a lower-than-expected burden. This discrepancy points to the powerful influence of unique national contexts. Contextual factors, such as specific healthcare policies, environmental regulations, and cultural attitudes, are crucial for comprehending and addressing the migraine burden at an actionable, country-specific level.16,18
The observed age-specific patterns revealed a distinct biphasic burden profile, requiring life-course intervention. The peak of incidence in the 25–29 age group likely reflects a convergence of early-career stressors, maximal hormonal volatility associated with the peak reproductive years, and systemic barriers to healthcare access when initiating childbearing.11,12,26 In contrast, the peak of prevalence and DALYs shifted to the 40–44 age group. This change highlights the cumulative effects of disease chronicity and significant work-family strain, which often hinders effective self-management. Furthermore, it underscores the impact of earlier perimenopausal onset commonly observed in these populations. These factors contribute to accumulating disability over time.6,27 Additionally, crude migraine rates were consistently highest across all age groups in GNI-L, highlighting an amplified, non-age-specific vulnerability. Such a vulnerability can be attributed to a constellation of factors prevalent in resource-limited settings, including pervasive diagnostic delays, limited access to preventive and acute treatments, and potentially greater exposure to environmental triggers. This confluence of challenges culminates in a higher overall burden, regardless of the specific life stage.6
The decomposition analysis provides critical, detailed insights into the divergent drivers of the increasing migraine burden across economic subgroups. It moves beyond describing overall trends to identify and quantify the underlying drivers.14,16 The findings confirm that the substantial increase in the absolute burden masks fundamentally different underlying mechanisms when stratified by income. In GNI-L and GNI-LM, population growth accounted for more than 100% of the observed net increase across all metrics, overwhelmingly and consistently driving the rise. In these settings, epidemiological changes (as reflected in age-specific rates) paradoxically exerted a slight protective effect, offsetting some of the growth driven by demographics. This pattern strongly suggests the presence of significant diagnostic gaps and systematic underreporting in the most resource-limited settings, which may mask the true scale of the disease burden.16,24,28 Conversely, a complex tripartite driver profile was noted in GNI-UM. While population growth remained a primary contributor, its relative role was diminished. More critically, epidemiological changes acted as powerful synergistic drivers, contributing between 37.24% and 45.42% to the increase. This shift indicates that factors beyond demography are actively exacerbating the migraine burden in these economies. These likely include improved case detection, facilitated by greater healthcare access and awareness. Concurrently, increased exposure to environmental and occupational triggers—especially fine particulate matter (PM2.5) derived from rapid industrialization and urbanization in GNI-UM—exerts a critical effect. PM2.5 can induce neurovascular inflammation, oxidative stress, and meningeal vasodilation, which are core pathophysiological mechanisms of migraine. In addition, reproductive-age women with inherent hormonal fluctuations are more susceptible to such environmental exposures, further exacerbating the onset, severity, and chronicity of migraine.13,24 Furthermore, population aging has become a significant additional driver in GNI-UM, substantially increasing the burden for prevalence and DALYs. This trend reflects both the cumulative nature of the disorder and, as societies develop, a demographic shift toward a larger proportion of women within the older, higher-risk subgroups of the 15–49 age range.
The ARIMA modeling demonstrated a robust fit to the historical data and projects a concerning and persistent rise in the migraine burden among reproductive-age women in LMICs through 2050. This projected upward trend in age-standardized DALYs rates contrasts sharply with the global trajectories of several other neurological disorders. The contrast underscores migraine’s status as a growing yet uniquely neglected public health priority in these regions.10,21 This projection directly follows from the key drivers identified in our study. Without effective, targeted interventions, the relentless demographic momentum in lower-income nations and the powerful synergistic effect of epidemiological changes in GNI-UM will continue to drive the burden higher. Consequently, millions of additional DALYs are projected by 2050, with profound implications for individual well-being, healthcare systems, and economic productivity.9
The decomposition, economic correlation, and age-stratified analyses reveal that a proactive, stratified public health response is necessary to counter this projected trajectory. Therefore, a dual-pronged strategic framework is proposed. In GNI-L/LM, where population growth is the dominant driver, priorities should center on foundational strengthening. This includes scaling up community-based screening to address diagnostic delays,29 task-shifting headache care to mid-level providers to expand access,9 and ensuring the reliable availability of essential migraine medications through centralized procurement to prevent stockouts.30,31 For GNI-UM, where epidemiological changes and aging are key drivers, the focus must shift to mitigating these specific risks. This includes implementing stricter environmental regulations on PM2.5 emissions,21 integrating subsidized neuromodulation devices and newer prophylactics such as CGRP inhibitors into public health coverage systems,9,32 and leveraging AI-assisted platforms to reduce diagnostic delays.33 Across all subgroups, legislative models ensuring migraine-friendly workplaces are crucial to reducing productivity losses and the resultant employment disadvantages.30,34 Hence, implementing these income-sensitive and age-aware strategies is imperative to alter the current trajectory and mitigate the rising burden of migraines among reproductive-age women in LMICs.
The present investigation has several inherent limitations. First, diagnostic constraints and significant resource limitations, particularly in Sub-Saharan Africa, likely lead to an underestimation of the true disease burden.6 Second, while GBD modeling provides standardized estimates, its reliance on extrapolation in regions with limited surveillance data may introduce geographic bias. Differences in case identification methods across income groups also contribute to methodological heterogeneity.35,36 Third, because current migraine disability weights do not fully capture cognitive impairment or the interictal burden, they may underestimate the full impact of the disease.8,21 Finally, the inherent time lag in GBD 2023 data means that the analysis may not fully reflect recent disruptions in healthcare delivery. While the ARIMA projections are statistically robust, they cannot incorporate the effects of unforeseen therapeutic advances or health policy reforms.15
Conclusion
Our analysis reveals a substantial increase in the absolute burden of migraine (crude rates and absolute case numbers) among women aged 15–49 years in LMICs from 1990 to 2023. The absolute number of incident cases, prevalent cases, and DALYs elevated substantially by 67%, 61%, and 68%, respectively. This surge was predominantly driven by population growth, which contributed over 100% of the net increase in GNI-L and GNI-LM. Notably, the subgroup analysis by income revealed different drivers. Epidemiological factors exerted a slight protective effect in lower-income settings, but acted as a significant synergistic driver in GNI-UM, contributing 37%–45%. Additionally, population aging differentially influenced disease metrics across income levels.
These findings underscore the imperative to develop income-stratified public health strategies. The results are generalizable to reproductive-age women (15–49 years) with migraine in LMICs, providing robust evidence for the monitoring of population-level burden and targeted interventions. For other populations (eg., males, postmenopausal women, or individuals in high-income countries), the burden trends and driving mechanisms may differ due to hormonal variations, socioeconomic disparities, and divergent healthcare conditions. In clinical practice, the data support risk screening and tailored management for reproductive-age women. In public health policy, they provide a reference for the allocation of resources and preventive planning across LMICs at different economic levels. In lower-income regions, strategies should focus on foundational strengthening of healthcare systems to manage the demographic-driven burden, including community-based screening and task-sharing initiatives. In contrast, GNI-UM must prioritize mitigating epidemiological risks through environmental regulations and by integrating advanced therapies into healthcare systems. For achieving UN Sustainable Development Goal 3, it is necessary to integrate migraine management into primary healthcare frameworks. Specific attention should be paid to the divergent burden patterns identified in this study.
Data Sharing Statement
The original contributions presented in the study are included in the article; further inquiries can be directed to the corresponding author.
Author Contributions
All authors contributed significantly to the reported work, whether in its conception, study design, execution, data acquisition, analysis, or interpretation; participated in drafting, revising, or critically reviewing the article; gave final approval of the version to be published; agreed on the journal to which the article was submitted; and agreed to be accountable for all aspects of the work.
Funding
The authors declare that they did not receive any funding from any source.
Disclosure
The authors declare that they have no competing interests in this work.
References
1. Deodato M, Granato A, Martini M, Sabot R, Buoite Stella A, Manganotti P. Instrumental assessment of pressure pain threshold over trigeminal and extra-trigeminal area in people with episodic and chronic migraine: a cross-sectional observational study. Neurol Sci. 2024;45(8):3923–16. doi:10.1007/s10072-024-07372-4
2. Su M, Yu S. Chronic migraine: a process of dysmodulation and sensitization. Mol Pain. 2018;14:1744806918767697. doi:10.1177/1744806918767697
3. Terruzzi A, AlMadani A, Al-Rukn S, et al. A retrospective analysis of disease epidemiology, comorbidity burden, treatment patterns, and healthcare resource utilization of migraine in the United Arab Emirates. Pain Ther. 2024;13(5):1235–1255. doi:10.1007/s40122-024-00634-1
4. Korolainen MA, Tuominen S, Kurki S, et al. Burden of migraine in Finland: multimorbidity and phenotypic disease networks in occupational healthcare. J Headache Pain. 2020;21(1):8. doi:10.1186/s10194-020-1077-x
5. Takizawa T, Danno D, Ishii R, et al. The dual impact of ictal and interictal burden in migraine: an analysis from the ObserVational survey of the Epidemiology, tReatment, and Care Of MigrainE (OVERCOME) Japan second study. J Headache Pain. 2025;26(1):140. doi:10.1186/s10194-025-02079-z
6. Aderinto N, Olatunji G, Kokori E, et al. Prevalence, characteristics, and treatment outcomes of migraine headache in Nigeria: a systematic review and meta-analysis. J Headache Pain. 2024;25(1):172. doi:10.1186/s10194-024-01869-1
7. Satapathy P, Chauhan S, Gaidhane S, et al. Trends in migraine and tension-type headaches in South Asia: findings from the Global Burden of Disease Study 2021 (1990-2021). Front Neurol. 2025;16:1514712. doi:10.3389/fneur.2025.1514712
8. Lo SH, Gallop K, Smith T, et al. Real-World experience of interictal burden and treatment in migraine: a qualitative interview study. J Headache Pain. 2022;23(1):65. doi:10.1186/s10194-022-01429-5
9. Saha S, Chowdhury D, Wadhwa M, et al. Impact of migraine on productivity and efficiency among adult population in India: a scoping review. J Headache Pain. 2025;26(1):180. doi:10.1186/s10194-025-02112-1
10. Steinmetz JD, Seeher KM, Schiess N, et al. Global, regional, and national burden of disorders affecting the nervous system, 1990-2021: a systematic analysis for the Global Burden of Disease Study 2021. Lancet Neurol. 2024;23(4):344–381. doi:10.1016/S1474-4422(24)00038-3
11. Ansari T, Lagman-Bartolome AM, Monsour D, Lay C. Management of menstrual migraine. Curr Neurol Neurosci Rep. 2020;20(10):45. doi:10.1007/s11910-020-01067-x
12. Cupini LM, Corbelli I, Sarchelli P. Menstrual migraine: what it is and does it matter? J Neurol. 2021;268(7):2355–2363. doi:10.1007/s00415-020-09726-2
13. Portt AE, Orchard C, Chen H, Ge E, Lay C, Smith PM. Migraine and air pollution: a systematic review. Headache. 2023;63(9):1203–1219. doi:10.1111/head.14632
14. Qin C, Liu M, Liu J. Trends and disparities of disease burden in infections among pregnant women in 131 low-income and middle-income countries, 1990-2019. J Glob Health. 2024;14:04130. doi:10.7189/jogh.14.04130
15. Wang YX, Lu GS, Zhao JJ, et al. The burden of migraine and predictions in the Asia-Pacific region, 1990-2021: a comparative analysis of China, South Korea, Japan, and Australia. J Headache Pain. 2025;26(1):104. doi:10.1186/s10194-025-02048-6
16. Cen J, Wang Q, Cheng L, Gao Q, Wang H, Sun F. Global, regional, and national burden and trends of migraine among women of childbearing age from 1990 to 2021: insights from the Global Burden of Disease Study 2021. J Headache Pain. 2024;25(1):96. doi:10.1186/s10194-024-01798-z
18. Wijeratne T, Oh J, Kim S, et al. Global, regional, and national burden of headache disorders, 1990-2021, with forecasts to 2050: a Global Burden of Disease study 2021. Cell Rep Med. 2025;6(10):102348. doi:10.1016/j.xcrm.2025.102348
19. Yu Q, Xue F, Wik SL, et al. Mapping disease burden of major depressive disorder and its risk factors in low- and middle-income countries. Psychother Psychosom;2025. 1–11. doi:10.1159/000547927
20. Hua Y, Liu J, Ji K, Han W. Global trends and regional disparities in atrial fibrillation and flutter burden attributable to high alcohol consumption: findings from the global burden of disease study 2021. BMC Cardiovasc Disord. 2025;25(1):266. doi:10.1186/s12872-025-04699-4
21. Dong L, Dong W, Jin Y, Jiang Y, Li Z, Yu D. The global burden of migraine: a 30-year trend review and future projections by age, sex, country, and region. Pain Ther. 2025;14(1):297–315. doi:10.1007/s40122-024-00690-7
22. Piccininni M, Brinks R, Rohmann JL, Kurth T. Estimation of migraine prevalence considering active and inactive states across different age groups. J Headache Pain. 2023;24(1):83. doi:10.1186/s10194-023-01624-y
23. Della Pietra A, Gómez Dabó L, Mikulenka P, et al. Mechanosensitive receptors in migraine: a systematic review. J Headache Pain. 2024;25(1):6. doi:10.1186/s10194-023-01710-1
24. Stovner LJ, Hagen K, Linde M, Steiner TJ. The global prevalence of headache: an update, with analysis of the influences of methodological factors on prevalence estimates. J Headache Pain. 2022;23(1):34. doi:10.1186/s10194-022-01402-2
25. Kang S, Eum S, Chang Y, et al. Burden of neurological diseases in Asia from 1990 to 2019: a systematic analysis using the Global Burden of Disease Study data. BMJ Open. 2022;12(9):e059548. doi:10.1136/bmjopen-2021-059548
26. Alwhaibi M, Alhawassi TM. Humanistic and economic burden of depression and anxiety among adults with migraine: a systematic review. Depress Anxiety. 2020;37(11):1146–1159. doi:10.1002/da.23063
27. Wei D, Wong LP, He X, Loganathan T. Healthcare utilisation and economic burden of migraines among bank employees in China: a probabilistic modelling study. J Headache Pain. 2024;25(1):60. doi:10.1186/s10194-024-01763-w
28. Duburcq A, Molins M, Debremaeker S, et al. Overview of migraine care, impact of the disease, and patient experience in France through patient voices: a cross-sectional and participatory survey study. J Headache Pain. 2025;26(1):76. doi:10.1186/s10194-025-02018-y
29. Zhao Y, Yi Y, Zhou H, Pang Q, Wang J. The burden of migraine and tension-type headache in Asia from 1990 to 2021. J Headache Pain. 2025;26(1):49. doi:10.1186/s10194-025-01990-9
30. Lin L, Zhu M, Qiu J, et al. Spatiotemporal distribution of migraine in China: analyses based on baidu index. BMC Public Health. 2023;23(1):1958. doi:10.1186/s12889-023-16909-9
31. Zhang YJ, Li XY, Guo ZL. Temporal trends of migraine and tension-type headache burden across the BRICS: implications from the Global Burden of Disease study 2019. Front Neurol. 2023;14:1307413. doi:10.3389/fneur.2023.1307413
32. Barbanti P, Aurilia C, Torelli P, et al. Three-year treatment with anti-CGRP monoclonal antibodies modifies migraine course: the prospective, multicenter I-GRAINE study. J Neurol. 2025;272(2):170. doi:10.1007/s00415-025-12911-w
33. Sun X, Chen B, Qi Y, et al. Multi-omics Mendelian randomization integrating GWAS, eQTL and pQTL data revealed GSTM4 as a potential drug target for migraine. J Headache Pain. 2024;25(1):117. doi:10.1186/s10194-024-01828-w
34. Getz M, Charleston L, Armand CE, Willis AW, Seng E. Perceived discrimination and migraine-specific quality of life: a cross-sectional survey study in a Black/African American sample. Headache. 2025;65(10):1839–1849. doi:10.1111/head.14970
35. Wang L, Qin X, Jin L, et al. Global, regional, and national burden of atrial fibrillation and flutter associated with metabolic risk factors, 1990-2021. Front Cardiovasc Med. 2025;12:1578908. doi:10.3389/fcvm.2025.1578908
36. Huang K, Huang X, Qian S, Cai Y, Wu F, Luo D. Temporal trends of thyroid cancer in China and globally from 1990 to 2021: an analysis of the global burden of Disease Study 2021. Sci Rep. 2024;14(1):25538. doi:10.1038/s41598-024-77663-5
If you ask US-based Malawian DJ Queen Agnes how she rose to the top, she will tell you that she did not make her way into showbiz, but rather the entertainment business located her through bloodline.
Naturally, it was really inevitable for someone who had music stage maestro Bright ‘Livewire’ Nkhata as her father to forgo the trappings of the entertainment industry.
Queen Agnes busy at work. | Michael Lejon Photography
“Growing up as a daughter of a music legend in Malawi, music was never background noise in our home. It was the language that we spoke. It was how we celebrated, grieved and connected. So, in many ways the stage was always going to be part of my story,” said Queen Agnes from her base in Texas.
She may have not fallen in the music basket, but her eventual fate is not far off either.
Queen Agnes found a home in the DeeJaying trade where she continues to shape a rich narrative on the US radio scene.
Queen Agnes has become the first Malawian DJ to sign up as the official Afro-beats DJ for one of the big radio platforms 97.9 The Beat.
The platform is under Urban One, formerly Radio One, which is one of the largest US broadcasting companies targeting African-American audiences operating over 70 stations. The network reaches millions weekly across 15 markets with special focus on urban hip hop, R ‘n’ B, gospel formats and Afro-beats.
She said joining 97.9 The Beat is a milestone that means everything to her, not just professionally, but personally.
Queen Agnes said she feels she is finally making her father proud.
She said: “Growing up watching him, I understood early on that music is more than entertainment. It is an identity, community and a legacy. Everything I’ve done in my career has been in part a mission to make him proud and to carry that legacy forward.
“So, when I think about now having a platform this large, on a station this influential, to bring Afro-beats and African culture to Dallas and beyond, I feel like I am finally honouring that calling the level it deserves.”
The DJ said her recent success is not just a win for her, but for every young girl in Malawi or in diaspora who dares to dream big. She said she wants young girls to see their roots as an inspiration and a springboard to unleash their strength.
“I think what truly qualified me is my understanding of the culture. I am not just a DJ who plays Afro-beats — I am the culture. I was born in Malawi; I carry that heritage everywhere I go. That authenticity is something you can’t manufacture.
“When I step behind the mic or the decks, I am not performing a trend. I am telling a story that is deeply personal to me and deeply connected to the African diaspora,” she said.
Queen Agnes said she has cleared her way up through her involvement in corporate events, international stages, doping radio work in the UK and television appearances. Through that journey she has shared the stage with artists such as Davido, Ciara and Ky-Mani Marley.
She said: “I came in with a vision, not just a skill set. When I joined The Beat Invasion, the platform was already there — but I brought a clear sense of purpose to it. A commitment to community, cultural storytelling and making sure African music and its roots are represented with the depth they deserve.”
The DJ pays a tribute to the influence the music exploits of her father has had on her Djing career. She said her father showed her that an artist’s greatest responsibility is not fame, but a legacy.
“I wasn’t going to be a replica of my father. I had to discover what Queen Agnes brought to the culture. And over time, through school and church choir, musical theatre, acting in films and DJing, I found that my gift was in being the bridge — between the music and the audience, between African culture and the diaspora, between where I come from and where I am going,” she said.
Queen Agnes said although she wants to continue breaking new barriers in her career, but her deepest vision is to create pathways and institutions that give more young Malawian people an opportunity to realise their dreams.
She said: “I want to combine my love for the arts with real, tangible sustainable development. I believe creativity is one of the most powerful tools for transformation. Music, performance and storytelling are not just entertainment. They are vehicles for confidence, identity and economic opportunity.
“I believe arts can play a major role in transforming Malawi’s economy. Cultural tourism is one of the most powerful and sustainable industries in the world. Malawi has an incredibly rich cultural heritage that the world deserves to experience. I want to help build the infrastructure that makes that possible.”
According to the 97.9 The Beat website, the radio station is one of the prominent contemporary radio stations based in Dallas, Texas. It serves the urban community with hip hop and R ‘n’ B and it is available online.
Two upcoming Clark County events will put Black and African culture front and center: The African Fashion Show PDX on April 18 and the Black History Fashion Show on May 23.
The African Fashion Show PDX, 3 to 7 p.m. April 18 at the Vancouver Innovation Center in Fisher’s Landing, is a fundraiser for the Portland-based Firmina Foundation, which provides school buildings and educational materials for children in Mozambique, Malawi and Zambia.
“We choose villages that have no schools, where children are still learning under a mango tree,” said Firmina Foundation founder Rukshana Triem, 49. “We support the village economy. We buy things from the village and use local labor.”
This is the African Fashion Show’s fifth year, said Triem, but it’s the first time the event will be in Clark County. She said she chose the Vancouver Innovation Center because the venue will allow the nonprofit to use its own caterer, Adesa Delicious Food, serving Angolan cuisine, mini chicken pot pies and Portuguese egg tarts.
“Most spaces want us to use their catering but they won’t let us do African food,” Triem said.
Triem said she expects about 300 attendees at the event. The show will feature African-inspired fashions by seven designers, modeled by 60 people of all ages and sizes. The first woman on the catwalk will be 70-year-old Portland comedian Deborah Wooten-Williams, who has spina bifida. Triem said she’ll model fashions from her wheelchair. The event will also feature African dance lessons for attendees as well as drumming by the seven-member, multiracial Stuhr Fire Rhythm Group.
“In this time, we need more gathering, we need more music, we need more artists,” Triem said.
The event’s cultural umbrella is quite broad, Triem said, especially considering that Africa is comprised of 54 countries. Triem herself has lived in three of them. She was 5 years old when her family fled a war in Mozambique, she said. They hiked through the mountains for two days before finding refuge in a village in Malawi. They eventually moved to a refugee camp in Zambia, where they lived for five years. In 1992, when Triem was 15, her family was granted asylum in the United States and they immigrated to San Diego.
Triem moved to Portland in 2003, when she was 28. She became active in local nonprofits and launched Women’s Lifestyle Coaching. She now helps women build businesses, she said, as well as taking them on confidence-building outdoor adventures.
Her business helps to finance the Firmina Foundation, she said, though the annual fashion show does more than raise funds for the nonprofit. The event is also a way to “support the business in our backyard,” she said, especially those owned by women and people of color. Triem said 17 vendors will be at the event. Some will sell artisan products such as African clothes and beads. Others are small-business owners, like the travel agent who can help people plan trips to Africa, Triem said.
“This is the moment for us to come together and share our culture, because culture opens up opportunities for us to get to know each other,” said Triem.
Author Ruby N. Lewis, chairwoman and president of the Vancouver nonprofit Please Don’t Die Black Men (aka PDDBM), will be at the event under her pen name Lewa Ubunifu. She’ll sell her children’s book, “Ifé Lela’s Magical Escape,” as well as her other books and plays.
Lewis will share a table with PDDBM’s treasurer and marketing manager, Imara Muraty, who will sell merchandise and clothing to support PDDBM. Meanwhile, PDDBM will host its own Black History Fashion Show and Cultural Experience on May 23 at Generations Church in Vancouver.
“These cultural events are extremely important for adults but even more important for the kids,” Lewis said. “The kids need to be able to say, ‘I am beautiful. It’s OK to have my skin color, it’s OK to have my hair, it’s OK to have my cultural aspects of myself.’ ”
The show will feature fashions by three young designers of color: Desiray Anner, 12; Yaretzy Garcia Flores, 10; and Lewis’ daughter, Marianna Leonard, 16. Anner and Leonard each created 11 outfits for the show and Flores created five. They’ve been learning fashion design in PDDBM-sponsored classes, which are intensive after-school courses lasting many months. The students designed clothes for all ages and sizes, ranging from babies to adults.
The show was originally scheduled for February in honor of Black History Month, but Lewis, Leonard and Muraty — who is training to be a fashion design teacher — were all injured in a car accident in November. Classes had to be suspended for many weeks while the three women healed, Lewis said, and the show was postponed to give students time to complete their outfits.
Each student will have their own website and business cards to help them promote their work. The show is also an opportunity to raise PDDBM’s profile in the community and draw attention to its educational and outreach programs. Toward that end, the organization will debut its new mascot at the event: a 7-foot-tall Black man inspired by the nonprofit’s logo.
The May 23 event will include two exhibits in addition to the fashion show. One exhibit will highlight West African tribal hairstyles from the era before the transatlantic slave trade, Lewis said, noting that slave traders shaved Africans’ heads, robbing them of a vital element of cultural identity. The other exhibit is “a mini fashion designer museum,” Lewis said. Twenty-six panels will offer biographical information and images of African American fashion designers from the 1860s to the present.
The Black History Fashion Show is a way to share Black culture with the Clark County community, but Lewis said it also fights back against the tide of negative messages for Black children and children of color. Lewis said her daughter, a student in Vancouver Public Schools, was the target of racially motivated aggression. Seeing her daughter hurt that way was a deep pain she wouldn’t wish on any parent, she said.
“We have to support kids,” Lewis said. “We have to make sure that they are confident and can express themselves in creative ways, whether it’s fashion design or whatever. We have to let them know they’re special and they matter.”
If the risk of sexual violence accumulates across economic strain, relational conflict, addiction, trauma, isolation, and distorted beliefs, then it makes sense that prevention, would need to be equally layered. Instead of one-dimensional awareness campaigns or interventions, more effective efforts seek to strengthen individuals, marriages, families, and communities at the same time.
If the first article mapped the terrain of vulnerability, the second this part turns to the work of building protection.
What would it look like to respond proportionately to what the evidence actually shows? If certain patterns repeatedly increase vulnerability, then their opposites ought tomust become deliberate priorities. In this section, I outline practical steps—grounded in the research reviewed previouslyabove—that families, faith communities, and civic institutions can take to reduce risk and expand real protection for women and children.
The protection of healthy, genuine faith
In part one, I outlined ways that limited religious community and faith commitment can increase the risk of sexual violence against women. The opposite is also true, with religious affiliation, identification and participation often protective against sexual violence according to studies in various countries. For instance:
A family’s “affiliation with Christian religious denominations” is “associated with lower risk of physical and sexual violence” in India (Kimuna, et al., 2013).
Being a Muslim was “protective from any type” of intimate partner violence” including “sexual and emotional” in the Ivory Coast (Peltzer & Pengpid, 2014).
The latter finding is mirrored in an earlier study finding Muslim religion protective against intimate partner violence in six African countries (Alio, et al., 2010).
Beyond affiliation alone, regular church attendance was specifically protective against victimization as well (Lown & Vega, 2001; O’Connor, et al., 2023). Respondents with higher levels of religious involvement in different studies were less likely to report intimate partner victimization (Zavala & Muniz, 2020) -with the latter U.S. research team noting this finding was “consistent with prior studies looking at the relationship between religious beliefs and intimate partner violence.” For instance:
“Frequent church attendance” is among the factors “associated with decreased risk of violence” in Filipino homes according to Fehringer & Hindin, 2009—who report “less male perpetration if mothers attended church more often”—in line with other findings, as they say “other research supports a protective effect of church attendance on partner violence.”
The same research team observed in a second article that “regular church attendance by the wife” and “regular church attendance by the husband” were both associated with lower risk of perpetrating violence in a marriage (Ansara & Hindin, 2009).
Fergusson, et al., 1986 highlighted “church attendance” as a significant factor in the frequency of “wife assault” in New Zealand—with the religious attendance of both fathers and mothers making the perpetration of victimization within their relationship less likely. They specifically found that men and women least likely to commit domestic violence were those who participate in services once a month or more are least -followed by those who attend less than monthly.
In an analysis of U.S. couples two decades ago, Ellison, et al., 1999 likewise reported that “regular attendance at religious services” made domestic violence perpetration less likely. “Both men and women who attend religious services regularly are less likely to commit acts of domestic violence than persons who attend rarely or not at all,” they observed—noting that for men, it was only when they participated weekly that this effect showed up, while women also had a protective effect with monthly attendance.
Overall, “religiosity does decrease (intimate partner) victimization” report Ellison, et al., 2007 based on a U.S. survey—adding that “religious involvement, specifically church attendance, protects against domestic violence”—a “protective effect,” which they note, is “stronger for African American men and women and for Hispanic men, groups that, for a variety of reasons, experience elevated risk for this type of violence.”
As reflected above, studies show repeatedly that faith participation can prevent both perpetration and victimization. This seems, in part, due to pro-social teachings, avoidance of risky behavior and a sense of higher purpose and meaning.
Victims often described in studies how leaders and fellow congregants helped them get away from earlier abuse and begin to find healing. This is not always true, of course—with certain attitudes held by people of faith sometimes functioning as a barrier to healing and safety. Indeed, another set of studies point towards less healthy religious attitudes that leave women at greater risk for different kinds of abuse.
Conflicting evidence
Even so, the influence of religion is not as simple as described above—with more nuance to consider. Psychological, physical and sexual violence had a “significant association” with evangelical faith in a Brazilian study—with the authors reporting a “33% increase in intimate partner sexual abuse in life in evangelical women, compared to those who do not belong to this group” (Santos, et al., 2020).
How exactly to interpret these and other seemingly contradictory findings is a critical point, something I explore in-depth in my full report. In simple form, not all religiosity is the same, with religious faith that allows men to dominate women, or which does not place serious emphasis on avoiding alcohol or casual sex, putting women (and children) at risk.
“Misinterpretation of religious beliefs” was cited in a Pakistani analysis of influences on sexual and other kinds of violence at home, with the authors advocating for “public policy informed by correct interpretation of religion” which they said could prompt “a change in prevailing societal norms.”
Religious institutions may reduce the risk of violence in a relationship.
After analyzing data from the Philippines, another research team notes that religious institutions may reduce the risk of violence in a relationship “by promoting messages encouraging a commitment to family life, providing counseling in conflict resolution or alcohol-related problems, providing information about resources in the community …. and providing an opportunity for strengthening social networks.”
In addition, there’s also evidence that sincere, “intrinsic” religious practice and conviction among men and women functions as a more powerful protector against sexual violence and other abuse, while more superficial, “extrinsic” religious conviction simply does not. It seems clear that “weak commitment to religion” could be a factor in victimization within a relationship, Vakili, et al., 2010 notes that a “woman and husband’s weak level of religious commitment” in Iran was “significantly associated with an increase in physical, sexual, and psychological abuse.”
The authors later said that “strong religious beliefs may be instrumental in reducing the likelihood of intimate partner violence among Iranian families” (Vakili, et al., 2010).In the other direction, deeper and more sincere religious conviction shows promising effects—with “religious intensity” associated in another study with a “lower victimization count” (Sabina, et al., 2013).
Complex, overlapping patterns of vulnerability
While this broad array of variables involved in increasing (or decreasing) the risk for sexual violence can seem overwhelming, I believe it can be invaluable to know that, broadly speaking, women and men who have experienced significant past abuse, who are under heavy current stress and financial pressures and are experiencing compromised faculties, significant conflict and real isolation, are all at much higher risk of future victimization (and perpetration)—especially if they have little awareness about the extent of the risk.
By contrast, women and men who have been protected from past abuse, who are not facing current heavy stress or compromised faculties, who don’t have significant conflict or isolation, will all be significantly more protected against future victimization (and perpetration)—especially if they have adequate awareness about the extent of the risk.
To the degree a woman or man falls on a higher or lower place on any of these spectrums (more past trauma, but lower stress levels today … less conflict, but also greater isolation), their level of risk (and protection) will likewise vary widely.
In addition, women who are less educated, divorced, addicted (or with partners addicted to alcohol or pornography) are more likely to experience sexual violence—especially if they experience inadequate financial support, limited healthy community commitments, and a dearth of higher meaning and spiritual purpose in life.
Perpetrators focus on places where any vulnerability exists
Even one risk factor can have rippling effects—with the sheer, cumulative risk of risk factors also corresponding with greater risk. One researcher, for instance, observed “six percent of young white women with no risk factors, nine percent of those with one, 26 percent of those with two, and 68 percent of those with three or more had been sexually abused before or during adolescence” (Moore, et al., 1989).
Certainly, none of the above factors operates in a vacuum independent of each other—with interlinkages among all ten factors. For instance, people of faith are also more likely to avoid drug/alcohol dependency, experience nurturing social support and be happily married (while also having more children).
But overall, the research makes it clear that perpetrators focus on places where any vulnerability exists. For instance, women of younger age and much older age are both more likely to be victimized, as are those with reduced cognitive or physical capacity due to disability or prior victimization.
Some factors are more changeable than others, obviously. But even those that appear unchangeable (past abuse) have interventions that can prompt healing. On a general level, as reflected above, “a person’s routine and lifestyle influences the level of exposure one has to potential perpetrators and how vulnerable one is as a target,” as Walker, et al., 2020 state. Consequently, “the identification of variables that influence likelihood of (sexual violence) is fundamental for prevention efforts” (Thomas & Kopel, 2023).
Alignment with other studies
Many of these themes have been identified in other attempts to survey available risk factors, such as a CDC analysis from 2016, which touched on most of the above patterns, but overlooked the potentially protective role of faith and religiosity.
This national and international data also align with demographic data collected locally in Utah, showing higher vulnerability to sexual violence among women who are homeless, with lower socioeconomic status, using drugs or alcohol, in minority groups, younger, or experiencing some kind of physical or mental impairments.
One especially impressive University of Washington literature review from 2017 concluded that the available evidence “reinforces the long-standing notion that sexual aggression is a complex behavior that emerges based on the interplay of multiple risk factors over time.”
“Additionally,” they note “there are likely very different pathways to the development of sexually aggressive behavior.
As Casey & Masters, 2017 conclude, “This means that preventing sexual aggression before it begins necessitates prioritizing multiple risk factors, and bolstering multiple protective factors across individuals and communities.”
The only real purpose of such study, of course, is taking better steps to protect women from sexual violence.
Better data, better prevention
The CDC advocated nearly two decades ago for building a comprehensive ecological model that “offers a framework for understanding the complex interplay of individual, relationship, social, political, cultural, and environmental factors that influence sexual violence” —all of which they note can inform specific intervention and prevention steps.
In an early 2004 exploration of what sexual violence prevention programs should look like, the CDC called for prevention efforts that “work to modify and/or entirely eliminate the events, conditions, situations, or exposure to influences (risk factors) that result in the initiation of sexual violence” and thereby proactively take steps to “prevent sexual violence from initially occurring.”
Yet a decade later in 2014, CDC researchers admitted (as I cited earlier) “rates of sexual violence remain alarmingly high, and we still know very little about how to prevent it,” going on to describe how most prevention efforts were largely “one dimensional” attempts to change individual attitudes, and little more.
Kathleen C. Basile, Associate Director for Science in the Division of Violence Prevention, in the Center for Injury Prevention and Control at the CDC, told me in an interview with Deseret News, “I would also add that sexual violence, intimate partner violence, all types of violence are preventable, and the way we prevent them, like you alluded to earlier, is to understand the size of the problem and who is impacted, and so the characteristics, like who the perpetrators are, who, what age, it happens, things like that” (italics my own).
In a 2014 review of strategies to prevent sexual violence perpetration, CDC researchers stated that “the vast majority of preventative interventions evaluated to date have failed to demonstrate sufficient evidence of impact on sexual violence perpetration behaviors.”
They went on to call for “an evidence-based, comprehensive, multi-level strategy to combat sexual violence,” suggesting that “addressing a broader range of risk and protective factors for sexual violence may be more likely to be effective.”
Two years later in 2016, the CDC released a prevention resource prevent sexual violence called “STOP SV”—noting that although the evidence for sexual violence prevention is “less developed” than other areas of prevention, “a comprehensive approach with preventive interventions at multiple levels of the social ecological model (i.e., individual, relationship, community, and societal) is critical to having a population level impact on SV.” But they noted that evidence remained “limited and must continuously be built through rigorous evaluation.”
As CDC researchers summarized in 2016, “Risk for sexual violence perpetration is influenced by a range of factors, including characteristics of the individual and their social and physical environments. These factors interact with one another to increase or decrease risk for SV over time and within specific contexts.”
CDC researchers also wrote in 2016 that “prevention strategies that address risk and protective factors for sexual violence at the community level are important components of a comprehensive approach,” before lamenting that “few such strategies have been identified or evaluated.”
Ten life patterns that increase protection
Our review of these root contributors paints a picture of what deeper strategies of protection would look like. For instance, men who are less educated, financially struggling, addicted, isolated, emotionally unhealthy, promiscuous and spiritually disengaged, are also more likely to perpetrate sexually on vulnerable women.
There’s also protective power in more fully appreciating that women and men who are better off economically, have good educational experiences, and are embedded within both healthy marriages and supportive communities are less vulnerable to sexual violence. This is doubly true if they also avoid substance abuse and habits of risky, casual sexual relations with multiple people, while nourishing a healthy spiritual foundation.
Here are the ten steps that follow from this research broken down:
Helping lift families and communities out of poverty
Expanding educational opportunities for both women and men
Helping nurture marriages and families that are healthy and happy
Providing additional support for younger and larger families
Helping to prevent compulsivity and support addicts in finding freedom
Encouraging the value of sexually-exclusive marriages and healthy, non-aggressive masculinity
Fostering deeper healing for mental health challenges
Helping those who have experienced earlier abuse to work through post-traumatic symptoms
Expanding robust community connections and durable social support
Fostering healthy spirituality and religious connection
To see a broader summary of concrete steps, go here for the Deseret News article. Some of these ten themes are reflected in a 2016 prevention resource released by the CDC called “STOP SV.” This resource highlighted research-based recommendations that include efforts to “provide opportunities to empower and support girls and women, support victims/survivors to lessen harms, create protective environments, teach skills to prevent sexual violence and promote social norms that protect against violence.”
As reflected above, some of the best ways to ensure women remain safe may be to proactively encourage life and community patterns proven to protect against both victimization and perpetration, including:
Healthy marriages that are cooperative and satisfying, surrounded by layers of trustworthy community support.
An atmosphere where education is prioritized and there are adequate resources to provide for the financial needs of the family, while helping both men and women avoid drugs and alcohol, delay sexual behavior until marriage, and learn how to control anger and impulses.
A hopeful environment that nurtures healing from past trauma and current mental health challenges, while ideally also providing a grounding sense of higher purpose and spiritual meaning.
According to the evidence, women embedded in this kind of a context will be significantly less likely to be sexually victimized (or abused in other ways)—compared with those living within chaotic settings with poor education, financial deficits, fraying marriages, spiritual detachment, few healing resources, rampant substance abuse, sexual promiscuity and out of control anger.
Just as any vulnerability can be exploited by perpetrators, any time a vulnerability is shored up and turned into a strength, there is more protection against multiple kinds of abuse. Therefore, if we want to get at the roots of sexual victimization, more focus needs to go towards these kinds of protective life patterns, and additional ways to encourage and promote them.
Special thanks to Laura Whitney, Odessa Taylor, Jacob Orse, and Brigham Powelson for helping to gather and sift through published studies, and to Diana Gourley for helping edit the review. In addition to recent support from Deseret News, the author expresses thanks to Public Square Magazine for initial funding for the project.
If you or someone you love has experienced sexual assault of any kind and need additional support in the U.S., contact the National Sexual Assault Hotline (1-800-656-HOPE)- with virtual and text-based options available. This is a confidential networking service in the U.S. helping connect victims with local agencies who can offer therapeutic support across the country. Similar kinds of hotlines exist in many countries around the world.
Health promotion, education, and behavior assistant professor Leila Larson conducts her nutrition-focused maternal and child health research all over the world, and South Carolinians will soon benefit from her expertise. With funding from the USC Collaborative for Health Equity Research (CHEER), an equity-driven pilot project program recently established by the USC Office of the Provost, Larson has launched a new study focused on pica (i.e., the craving and consumption of non-food items, like ice, and sometimes earth, like clay or soil).
Pica impacts pregnant women across the globe, including women in the U.S. – particularly those in African American, Hispanic and rural populations. Complications of prenatal pica include anemia, abnormal gestational weight gain, high blood pressure, negative birth outcomes, and other adverse effects, but despite these serious consequences, pica continues to be undiagnosed and underreported.”
Leila Larson, Health promotion, education, and behavior assistant professor
Though understudied and extremely complex, scientists and clinicians suspect that one of the primary causes of pica is the deficiency of certain micronutrients, such as iron. Ironically, individuals with pica experience an urge to consume non-food items (e.g., soil, clay, baking powder, soap, cornstarch, chalk, paper products), which often fail to fill the nutrient gaps while also worsening the deficiencies by reducing absorption of nutrients and exacerbating unwanted health outcomes by potentially introducing toxins, heavy metals, parasites, and other dangerous substances to both mother and fetus.
In many parts of the world, pica is common and expected as it has long been seen as a normal part of pregnancy. In other areas, however, women hesitate to report their pica cravings and behaviors due to feelings of shame and fear of being stigmatized.
Only two studies have examined pica in populations in the U.S. in the last 25 years. In California, researchers found that 51% of Hispanic women had the condition. North Carolina scientists discovered that 38% of rural women had pica during pregnancy, yet 75% of the participants had no documentation of the condition in their medical records.
Related Stories
“Pica is viewed as a cultural practice, as well as a biological response to nutritional deficiencies, infection or stress,” Larson says. “But with so little research on the topic, we just don’t know enough about its prevalence, causes or impacts on pregnant women and their babies.”
Building on her pica research in Malawi, which showed a reduction in consumption of earth when iron supplementation was provided, Larson’s new study will shed light on which South Carolinians are most impacted by pica, what primarily causes pica in these populations, and how pregnant people experience pica in their everyday lives. By understanding their behaviors, perspectives, and experiences, the research team’s long-term goal is to develop culturally relevant screening and treatment protocols that can be used by health care providers in the Palmetto state and beyond.
Larson’s study brings together a team of clinical, community, and research experts to explore this ubiquitous yet poorly understood condition. Consistent engagement with the study’s Community Advisory Board will provide a much-needed perspective on the project’s research approaches, study materials, dissemination, and much more.
“The cultural roots and high prevalence of prenatal anemia in the Southern United States makes pica a critical public health issue for this region,” Larson says. “With this initial pilot project, we hope to lay the groundwork for a longer, more extensive study aimed at understanding the risk factors, behaviors, and clinical impacts associated with this condition, and how we might improve it using community-engaged research approaches.”